How you transform your business as tech consumer, habits industry
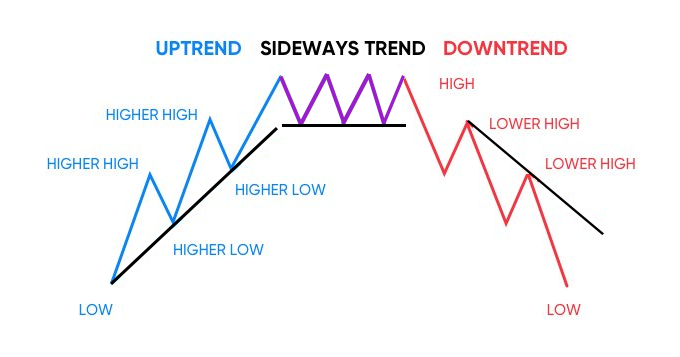
Stock Trends tell us the overall direction of the stock’s prices or the market as a whole. In technical analysis, trends can be analyzed by using trendlines or price action which tells us when the price is making higher highs for an uptrend, or lower lows for a downtrend.
Stock Trends can be divided into:
Profit and loss is a very mathematical and R&D process, which you will be going to learn in our courses and that will help you to understand the exact way to visualize the profit and loss formula in the stock market.
Technical indicators are technical tools that help in analyzing the ongoing trend and whether the current trend is going to reverse or not.
Traders can take the help of the Relative Strength Index (RSI) indicator that can be used in trend analysis strategies.
Traders can buy the stock it is trending up or down with strong momentum and sell it when the stock loses momentum.
We can teach stock market trend using Dandiya
A stop loss is intended to restrict a financial backer’s loss on a security position.
Quantitative trading comprises exchanging procedures in view of quantitative examination, which depends on numerical calculations and calculating to recognize open trading doors.
B 305/306, Stellar Building, Friends Colony, Sindhu Bhuvan Road, Bodakdev, Ahmedabad – 380 054.
Office Address:- Gali No.2 , Bhagwandas Market, Kankroli, Rajsamand, Rajasthan. 313324.
Mumbai, Jaipur